Market Analysis January 17, 2011
January 17, 2011 13:22
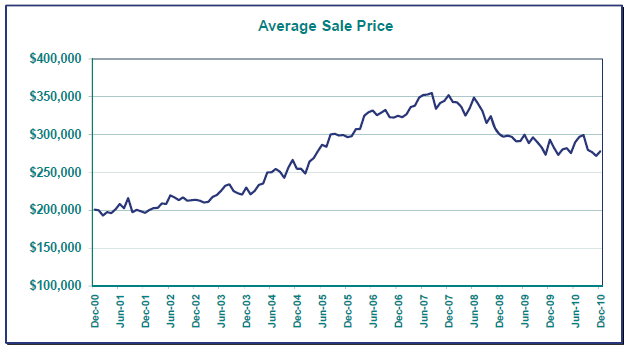
As promised, this blog post will be more robust including graphs and current market data. This first graph shows us the average sales price of homes in the Portland Metro Area for December 2000 to December 2010. As expected, this graph shows is that prices peaked in 2007, and that there has been a 20 to 25% decline in the average prices of homes. One little bump up in prices, that I would like to mention is the June 2010 peak where prices jumped up partially due to the tax credit. Also, this graph shows that we are in a valley right now, and this may be attributed to the seasonal nature of real estate in Portland. In the winter, prices drop because of seller fatigue. In the summer prices tend to go up because seller optomism.
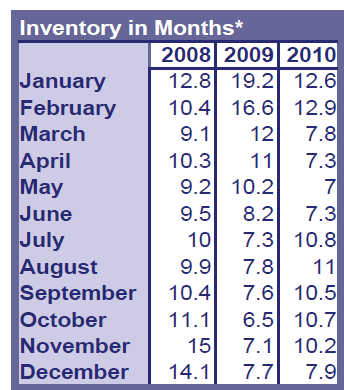
I would like to make a few comments about the next graph that covers inventory. By the way, as per RMLS, "Inventory in Months is calculated by dividing the Active Listings at the end of the month in question by the number of closed sales for that month". In other words, if no new houses come on the market, it would take X number of months to sell the current inventory. This number shows us if we are in a buyer's market, seller's market or equilibrium. The current inventory of 7.9 months is virtually the same as this time last year, and nearly half that if the previous year. This leads me to believe that 2011 will be more closely resemble 2010 in terms of sales and appreciation (depreciation) than previous years. "The average sale price for December 2010 declined 5.2% compared to December 2009. The median sale price also fell 5%." --RMLS Prices continued to fall in 2010; however, depreciation was at a much slower rate than in 2008 and 2009.
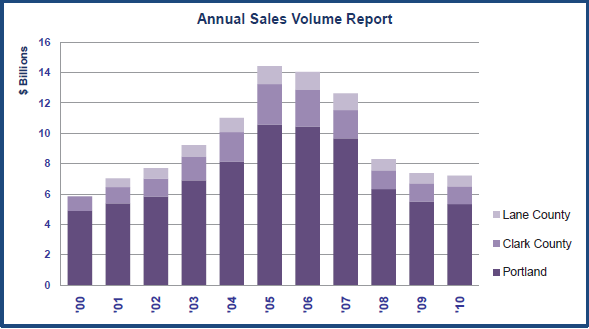
I find this graph interesting because it show the "bubble" perfectly in terms of sales volume. Sale volume went crazy in 2003 to 2007 because of easy money and real estate speculation; however sale volume in 2010 is virtually the same has 2000 sans speculators.
The graphs on this page are from the RMLS Market Action for January 2011.